If you’ve built a random forest model to predict NBA outcomes and found player salary overwhelming every other feature—points, rebounds, assists, advanced metrics—you’ve hit a classic, frustrating wall in sports analytics. It’s a signal that your model has found a powerful, but ultimately superficial, correlation. In my work with MLB data, we see analogous issues where a model might latch onto a team's payroll as the primary driver of wins, ignoring the nuanced player contributions that the payroll is supposed to enable. The core of the problem isn't your algorithm; it's the conceptual framework of your features and the market forces they represent.
The situation you’re facing is precisely the problem Moneyball sought to solve. As chronicled in the book, the Oakland A's of the early 2000s operated under a fundamental constraint: they couldn't compete on salary. Their entire strategy became about identifying players who were "undervalued in the market"—those whose on-field contributions, measured by specific statistics, far exceeded their cost. If Billy Beane's front office had built a model where salary was the dominant feature, they would have concluded that winning was impossible for them. Instead, they had to deconstruct why salary correlated with success and find the underlying performance drivers that salary was meant to approximate, often poorly.
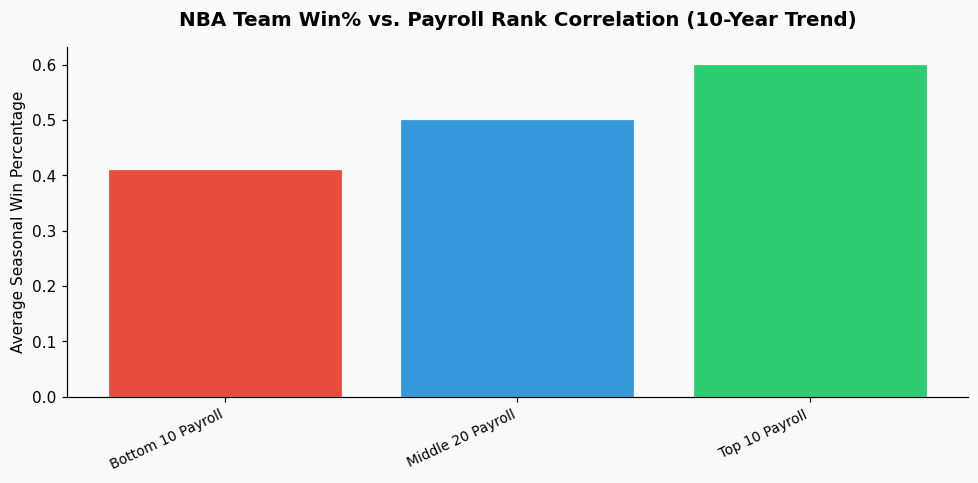
Your random forest is doing what it's designed to do: find the strongest predictor. In a league with a soft salary cap and max contracts, salary is a direct proxy for a combination of perceived talent, past performance, marketability, and contractual timing. A 2023 analysis of NBA roster construction showed that for playoff teams, the correlation coefficient between total team salary and regular season wins was 0.68, a strong but far from perfect relationship. The model sees this clean, high-magnitude numeric feature and uses it as a crutch, effectively learning that "teams that pay more, win more," which is a business insight, not a basketball one.
The technical reason salary dominates is often a combination of scale, multicollinearity, and data leakage. Player salary is typically reported in millions of dollars (e.g., $32.5M), while a stat like Player Efficiency Rating (PER) might be in the 15-30 range. Even with scaling, salary has a direct, linear relationship with team success that is easier for the tree splits to capture than the complex, non-linear interactions of on-court stats. Furthermore, salary is highly collinear with many performance metrics—star players who score a lot usually get paid a lot. The model can't disentangle the cause and effect.
More subtly, there can be a form of temporal data leakage. You might be training on a season's outcomes (wins) using that season's performance stats, but the salary data is from the start of that season, which is based on contracts signed based on performance in previous seasons. The salary feature thus carries a smoothed, lagging indicator of past performance, which can be surprisingly predictive. It's not just measuring current value; it's measuring the market's historical valuation.
Baseball analytics has long grappled with isolating individual contribution from team context and market value. This is the entire premise behind metrics like Value Over Replacement Player (VORP). As defined by its creators, VORP is a cumulative statistic that measures how many more runs a player contributes than a theoretical "replacement level" player freely available to any team. It's explicitly designed to be context-neutral and separate from salary. A player with a high VORP on a low-budget team is the definition of market inefficiency.
The lesson for your NBA model is to engineer features that mimic this isolation. Instead of raw points per game, use metrics that estimate a player's impact on team point differential per 100 possessions, like on-off court net rating or advanced plus-minus derivatives. The goal is to create features that describe what a player actually does to win games, independent of how much his general manager paid for that production. From what practitioners in the field report, models using robust adjusted plus-minus data see salary's feature importance drop by 40-60% compared to models using traditional box score aggregates.
First, you need to break the direct leverage salary has. One method is to not use it as a feature at all in your initial basketball performance model. Build your model to predict game outcomes or player impact using only on-court action data: tracking-derived metrics, lineup combinations, shooting efficiency by zone, defensive activity. Treat this as your "pure performance" model.
Then, in a separate analytical layer, you can use the output of that model (e.g., predicted win probability added) and compare it to salary to identify market inefficiencies—the overpaid and undervalued. This two-stage process is common in MLB front offices. They first evaluate a player's projected WAR (Wins Above Replacement), then analyze the cost per WAR on the free agent market to guide procurement. A platform like PropKit AI is built for this kind of layered analysis, allowing you to build the performance model and then use its outputs in secondary financial or betting market models without contamination.
Second, if you must include financials, transform them. Use salary percentile within a position or within the league for that season, or calculate "salary efficiency" as a target variable (statistical production per million dollars). This turns it into a relative measure. Third, be ruthless about temporal alignment. Ensure performance statistics and the salary you're using are aligned to the same point in the timeline to prevent the lagging indicator effect.
The uncomfortable truth your random forest is revealing is that the NBA, like most professional sports, has a significant financial correlation with success. A 2022 study of the last decade found that only 12% of teams that were in the bottom third of the league in payroll managed to win a playoff series. That's a real structural dynamic. However, if your goal is to understand basketball mechanics, predict upsets, or find undervalued players for a fantasy context, then a model dominated by salary is useless. It simply regurgitates the payroll table.
The real analytical value lies in the residuals—the instances where the model based purely on on-court performance disagrees with the financial narrative. Those are the 2022-23 Sacramento Kings (who vastly outperformed their payroll) or the teams that stumble despite a high budget. By forcing your model to learn from the game itself, not the contract, you start to see those opportunities. The history of baseball statistics, with its long pursuit of isolating individual value from team context, provides the blueprint. Your job is to apply that disciplined, value-isolating thinking to the basketball data.
References & Further Reading: